Offering rewards for architects and property developers who wield it well, Pedestrian-Level Wind (PLW) analysis (also known as Pedestrian Comfort analysis) is becoming a must-have for urban construction projects.
But in the world of architecture, engineering, and construction (AEC), PLW analysis is a fairly recent — and rapidly evolving — arrival. To get you up to speed, this guide talks all about:
- What PLW analysis is
- How PLW analysis works
- When you should perform it
- How to incorporate it into your design processes and project pitches
What is Pedestrian-Level Wind analysis?
Pedestrian-Level Wind — also called Pedestrian Wind Comfort, or simply Wind Comfort — analysis is a statistical examination of the mechanical effects of wind on the comfort and safety of pedestrians* in an urban environment.
*As we’ll see, “pedestrian” can have a fairly broad meaning. It is not limited to the common interpretation of “a person on a sidewalk”.
Although it could be used to assess current conditions (i.e., a city may want to baseline their urban environment) or even to understand what would happen if a building or other structure were to be removed, in most cases such analysis is undertaken to understand the impact of a new building or development project.
PLW analysis helps you understand which human activities are possible or preferable in the outdoor spaces included in the building you’re designing. This includes rooftops, terraces, patios, and balconies, as well as entrances/exits, paths/sidewalks, bus stops, and parks. It is a critical determinant of the building’s microclimate, which is affected by both solar and wind effects on the surrounding area.

Wind is complicated. Your wind simulation tool shouldn’t be.
Start your 30-day free trial of Orbital Stack today.
Putting comfort in context
In PLW analysis, “comfort” refers to how mechanical wind forces impact a particular type of activity — sitting, standing, jogging, cycling, etc.
Importantly, this very specific meaning:
- does not (and is not intended to) account for shadowing effects or exposure to non-wind elements (e.g., rain);
- isn’t about whether or not someone is cold or warm (thermal comfort); and assumes that any individuals are adequately dressed for whatever activity they are performing.
Different Perspectives
Much of the focus of Pedestrian-Level Wind analysis is to learn how to better direct the wind to avoid negatively impacting our ability to safely use and enjoy outdoor spaces — in particular by mitigating strong and sustained gusts.
However, this perspective is disproportionately influenced by temperate climates with strong seasonal fluctuations. In many parts of the world, one goal of wind engineering is to harness natural airflow to ensure cities and the outdoor spaces in and around buildings are well ventilated with a steady (but light) flow of wind.
Regardless of the specific aim, PLW analysis remains a valuable tool in the engineer’s box.
How does Pedestrian-Level Wind analysis work?
Different approaches vary in the details. In general, Pedestrian-Level Wind analysis models urban microclimate effects by simulating the interaction of the wind with the built environment. It places the results into actionable context by applying statistical distributions and thresholds against a defined set of comfort and safety criteria.
In the past, wind studies were performed using wind tunnels and physical models. Today, however, wind-tunnel testing — due to its comparatively higher cost and longer timelines — is typically reserved for the later stages of an architectural design process. In its place, software is used during the earlier stages as a much more cost-effective and timely means to test/validate designs and guide improvements within an iterative process.
Critical inputs for analysis
The software and other utilities that enable pedestrian-level wind analysis typically require as inputs:
- Historical meteorological data for the location under study
- Aerodynamic models of the built environment, with and without the building under study (i.e., for before-and-after comparisons)
- Comfort and safety criteria
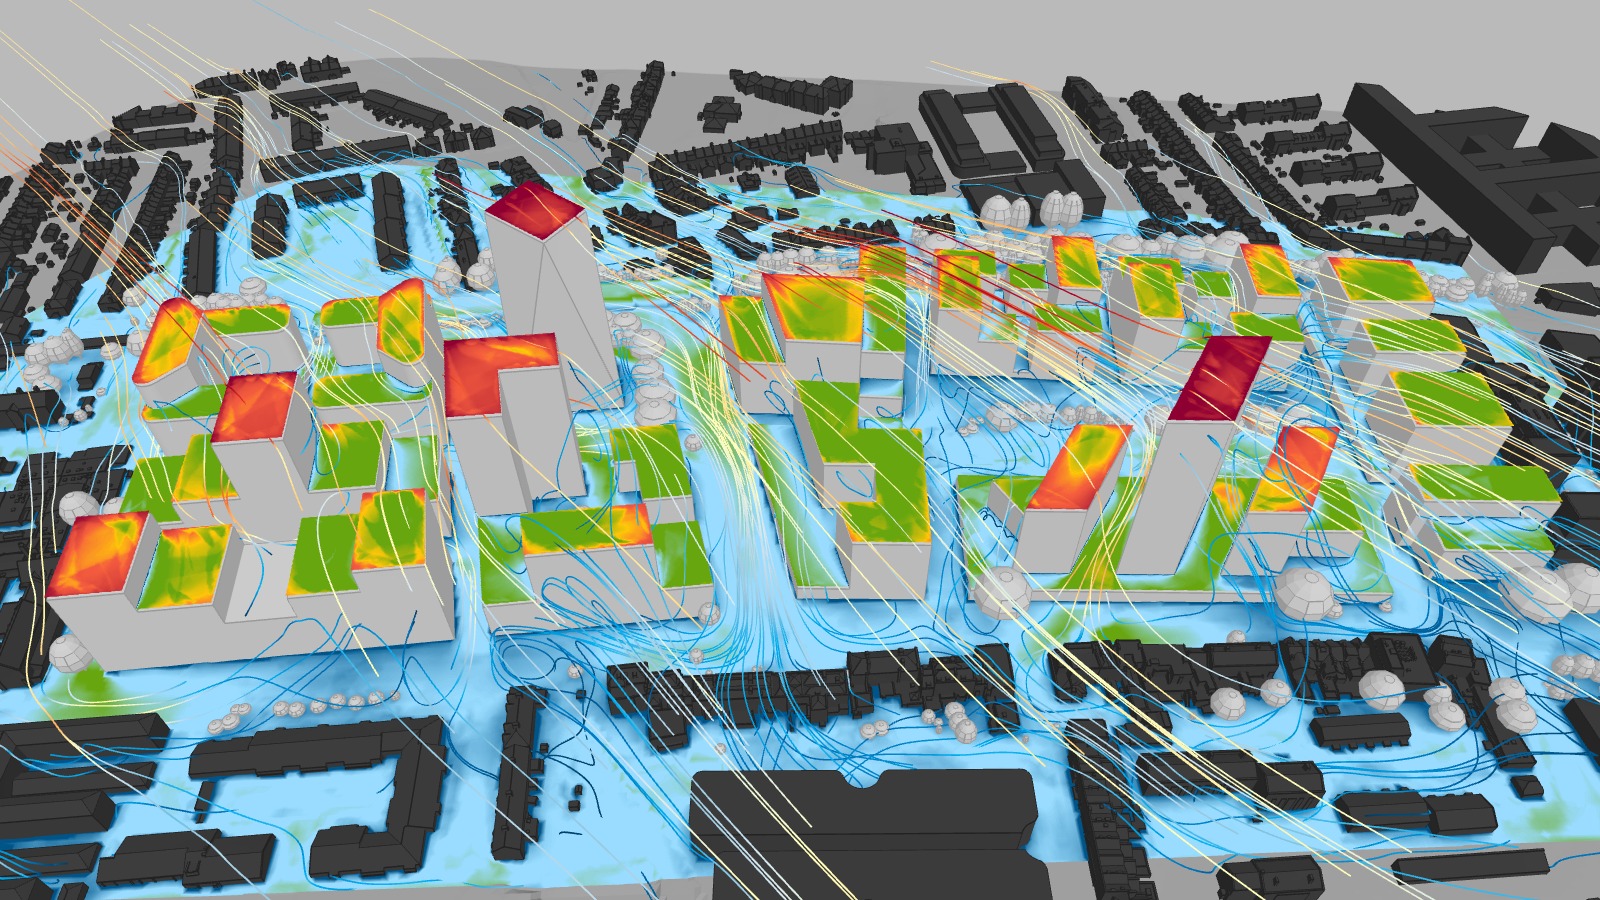
Essentially, the software takes the meteorological data, subjects the building and its surrounding urban environment to historical weather distributions, and calculates and measures the effects. Depending upon the designer’s needs, the tool’s capability, and the comfort and safety criteria being used, the simulations may consider different:
- Wind Directions: While some rudimentary analysis may incorporate as few as 2 prevailing directions, more comprehensive analysis may consider up to 32 directions. In general, wind speeds for a given location are determined by aggregating hour-by-hour wind data with the local flow patterns established by the simulation (or wind tunnel measurements).
- Seasons: An important fact to consider is that winds behave differently season-to-season. As a result, most PLW analysis criteria base their threshold wind speeds on weather data from at least two seasons (generally Summer and Winter), and some criteria factor in data from all four seasons.
- Times of Day: Winds also behave differently throughout the day, with intensity usually higher during the day. Furthermore, most pedestrian activity in outdoor spaces typically happens during the daytime. As a result, some Pedestrian Wind Comfort criteria exclude nighttime hours from their analysis. Some, however, use all 24 hours to inform their criteria. This is especially relevant for nightlife-oriented districts, where heavy pedestrian activity can be expected during nighttime hours.
The wind effects that emerge from the simulation are then statistically compared to the comfort and safety criteria. This shows designers what activities are possible in different outdoor spaces. With this approach, designers can spot potential issues, like a space intended as a dining patio sustaining strong winds. They can then implement mitigations to alter the wind’s flow.
Keeping Up With Growing Expectations
When it first appeared on the scene, Pedestrian-Level Wind analysis focused on wind forces at the literal level of pedestrians on the ground: approximately 1.5m above the ground’s surface.
Over time, the approach has evolved to include not just pedestrians in the strictest sense, but also cyclists, people sitting on benches or on a patio, etc. Similarly, expectations have also grown, and PLW analysis is now often expected to go beyond ground level to also consider any outdoor space where people will spend time — including rooftops, terraced patios, balconies, etc.
However, not all PLW analysis tools have kept pace, and many still only provide insights at 1.5m above ground level.
Different comfort needs
Pedestrians’ tolerance for wind impacts is primarily dependent on factors such as the activities they are engaged in. For instance, someone who is walking may tolerate — or even appreciate — a light breeze. Another person sitting and reading a paper may find such a breeze a nuisance.
Wind comfort criteria approximate this reality by identifying maximum tolerable windspeed thresholds for various pedestrian activities. They generally specify an “allowed exceedance” value, usually expressed as a percentage. This percentage specifies how often winds can exceed the threshold windspeed to remain in the ‘comfortable’ range.
Safety criteria follow the same approach, but capture the fact that above certain windspeeds activities become uncomfortable or downright unsafe. This is due to direct wind effects (e.g., the risk of being blown over) and other risks (e.g., of being hit by debris).
Comfort and safety criteria
Over the years, a number of different comfort and safety criteria have emerged, including:
- Lawson Wind Comfort Criteria, which is used globally
- Hunt et al Wind Criteria, which is primarily used in Taiwan
- RWDI Pedestrian Wind Comfort Criteria, which was developed in the 1970s and has been widely accepted by municipal authorities as well as by the building design and city planning community
- Several developed by specific cities (San Francisco, Boston, Melbourne, etc.), but which are also used elsewhere
These criteria all pursue the same broad goals, but differ in their details. Here are a few examples:
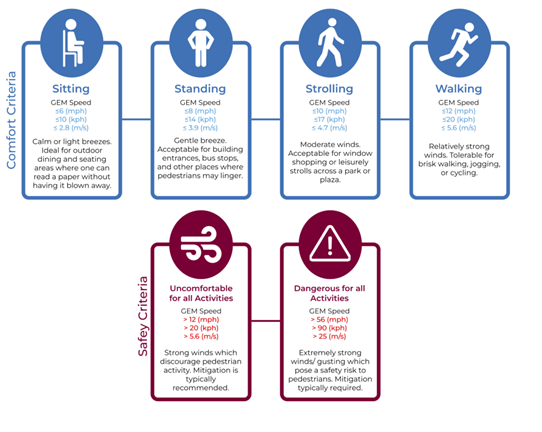
- Most comfort and safety criteria specify types of activity, but the activities vary. Lawson criteria distinguish between pedestrian sitting, pedestrian standing, pedestrian walking, and business walking, while others may consider sitting, standing, strolling, walking, etc.
- Hunt differentiates between short and long durations for sitting and standing, but most others do not
- Israeli wind criteria don’t use activities, but instead uses location types: seating zones, entrances and exits, and streets and parking
Additionally, some (including RWDI’s and Lawson) characterize wind conditions by the Gust Equivalent Mean (GEM). That is a measure that calculates an adjusted wind speed based on average wind speeds (steady-state) and wind gustiness (spontaneous) — while others use average speeds alone.
They may also vary in the wind speeds and thresholds used to evaluate safety and comfort. In RWDI’s Pedestrian Wind Comfort Criteria, comfort categories are defined such that the GEM must remain below the category threshold (see table below) at least 80% of the time. Other approaches may employ a different threshold.
When should you perform Pedestrian-Level Wind analysis?
So when do the benefits of performing PLW analysis outweigh the costs?
First, some cities outright require PLW analysis for new developments that meet certain criteria. This could be due to a building exceeding some maximum absolute height or some height relative to the surrounding area.
For example, Wind Microclimate Guidelines for Developments in the City of London “provides general guidelines for wind microclimate studies required as part of the planning applications of new development proposals in the City of London (CoL).” Developed in consultation with RWDI, these guidelines include a number of requirements relating to wind analysis requirements. They are widely believed to be the first in the world to specifically consider effects on cyclists.
Clearly, the benefit of performing PLW analysis — having your submission be accepted for review — outweighs any reasonable costs.
Further, even in circumstances where PLW analysis isn’t strictly required by a city or planning/approval body, it may be still recommended. Many savvy developers know that adhering to these recommendations is a sound strategy. However, the costs of performing the analysis must be considered — fortunately, those costs are falling dramatically.
Computational Fluid Dynamics (CFD)
For a number of years, analysis employing computational fluid dynamics (CFD) was the only alternative to expensive and timely wind tunnel testing. But while CFD is considerably cheaper and faster than getting ‘tunnel time,’ it still suffers from several drawbacks, including:
- the expertise that’s often required to configure the simulations;
- the delay between submitting a design for analysis and getting the results (often many hours, or even a few days or weeks for especially complex simulations); and
- the still-notable costs of doing so (typically hundreds of dollars per simulation).
- There is an excessive variety in CFD mathematical approaches. The vast number of CFD codes and approaches available reduces the reproducibility and quality of CFD results.
These restrictions limited CFD’s utility for comparatively smaller projects, and its ability to test and validate designs in a rapid and iterative manner — exactly the type of build-test-tweak cycle that can help designers make important improvements early (especially in the tight pre-pitch period) and avoid costly mistakes that may otherwise only surface much later on.
So, while CFD-based analysis provided many important benefits, those came at a moderate — but nonetheless meaningful — cost.
Enter artificial intelligence (AI).
Unlocking iteration with artificial intelligence (AI)
For all the hype — much of it justified, some of it not — around AI’s wide applications, and all of the attempts to describe what it is and does, perhaps the most useful description is that provided by Ajay Agrawal, Joshua Gans, and Avi Goldfarb in their book, Prediction Machines.
The eminent economists recast the rise of AI as a drop in the cost of prediction. You provide an AI engine with inputs, and it predicts what will happen — with those predictions serving as outputs.
Imagine a wind analysis engine powered by AI.
You provide it with inputs (e.g., meteorological data, CAD files, and your preferred comfort and safety criteria), and it predicts airflow patterns and relates them to the comfort and safety of people in outdoor spaces.
Now, the AI engine doesn’t do this PLW analysis with the same fidelity or precision as a CFW-based analysis, but — crucially — it does so in a fraction of the time and a fraction of the cost. Where CFD may take days or weeks of configuration and computing effort and cost hundreds or thousands of dollars, the AI-based approach takes a few minutes and costs the same as a cup of coffee.
How to incorporate PLW analysis into your design processes and project pitches
A Pedestrian-Level Wind analysis that’s too narrow in scope or conducted too late in the design cycle continues to be a common — and costly — source of project compromise and delay.
Fortunately, thanks to the low cost of prediction, the economics of PLW analysis are forever changed. Analysis once reserved only for the largest and most complex projects can now be applied to practically every project.
AI-based PLW analysis
One of the advantages of using AI to approximate the impacts of wind on pedestrians during the earliest design stages is that doing so is a fast and very low-cost way of assessing the viability of a project’s main concepts. Thanks to the technology’s ability to quickly iterate and test multiple design solutions at once, AI is a great way to explore alternate strategies, designs, and solutions to wind problems in a relatively fast and cost-effective way.
In particular, buildings that plan to incorporate outdoor spaces into their designs, or that will be located in windy locations (e.g., coastal sites, in an exposed environment, or in windy cities) would benefit from an early stage PLW analysis since the potential for negative wind comfort effects can be high. Analysis earlier in the project can help identify and solve the complex challenges of a design sooner, saving time now and avoiding costly mistakes later.
Additionally, having preliminary data that suggests positive outcomes of the design on pedestrians, others users, and the wider community can help make a strong case for the positive impact of a building and its alignment with sustainability and density. Showing the utility of outdoor spaces helps to increase the value — both real and perceived — of the proposal.
The advantages of AI
In short, applying AI-based PLW analysis to early designs helps make the vision of bustling spaces a reality by:
- Allowing for improvements when change is easy — and more affordable;
- Keeping projects on time and on budget by avoiding surprises during zoning approvals;
- Ensuring outdoor spaces and amenities can be used for their intended purposes;
- Preventing unsafe gusts and unwelcome buffeting;
- Considering seasonal wind patterns to extend availability and usability; and
- Equipping you with vivid and insightful imagery that demonstrates you have a firm understanding of wind effects.
CFD-based PLW analysis
As designs mature, more precision is needed to assess impacts, direct improvements, and inform necessary mitigations. CFD provides a nice balance of precision and cost (financial and time).
In particular, semi indoor-outdoor spaces, amenity decks, outdoor event areas, pools, terraces, and outdoor restaurants need special care in their design because their day-to-day use is so impacted by weather and wind conditions.
CFD-based PLW analysis can help you develop and refine wind control strategies to maximize the use of these amenities, especially as you also introduce other climatic considerations. These include the sun, temperature, and humidity — all of which contribute to the “total thermal comfort” of people.
Plus, CFD-based analysis is fast becoming a requirement in many jurisdictions. For example, the City of London’s guidelines specify when CFD simulation is recommended and when it is required, and provide detailed specifications on how such simulations must be configured.
Wind tunnel testing
Wind tunnel testing is the gold standard of testing, but is the most time-consuming and costly way to assess wind effects. Because of this, it is typically reserved until the latter stages of a design.
Ideally, if a design has undergone extensive AI- and CFD-based analysis in the earlier stages, wind tunnel tests are more about formally adhering to jurisdictional requirements and validating mature designs than about uncovering issues.
Wrapping up
Pedestrian-Level Wind analysis is rapidly turning from something that you occasionally do — and only when you have to — into a tremendously valuable tool that can benefit any project.
And thanks to technology advances that have dramatically reduced the costs and time associated with such analysis, designing stunning buildings that incorporate outdoor and hybrid indoor/outdoor spaces has never been as straightforward or as cost effective.
Try the only wind analysis tool based on real wind data.
Try Orbital Stack for free today.