
Creating comfortable outdoor environments is a complex endeavor. It hinges on understanding thermal comfort – an individual’s perception of temperature, influenced by both physiological and psychological factors. To analyze and optimize thermal comfort in different spaces, there are various thermal comfort indexes that can come into play.
In this blog, we will delve into two prominent indexes that are widely used in thermal comfort analysis: UTCI (Universal Thermal Climate Index) and SPMV (Standardized Predicted Mean Vote). These indexes offer different approaches to quantifying and interpreting thermal comfort, each with its own advantages and limitations. Join us as we explore the key distinctions between UTCI and SPMV, uncovering which one is best suited for specific climates, cultural contexts, and desired levels of analysis.
What is Outdoor Thermal Comfort?
Thermal comfort analysis combines wind and solar simulations of your site geometry with a complex array of climate data. This includes metrics like temperature, humidity, cloud cover, activity level, clothing, wind direction and speed, summarizing the results in plots that indicate the overall thermal comfort of patrons in that space.
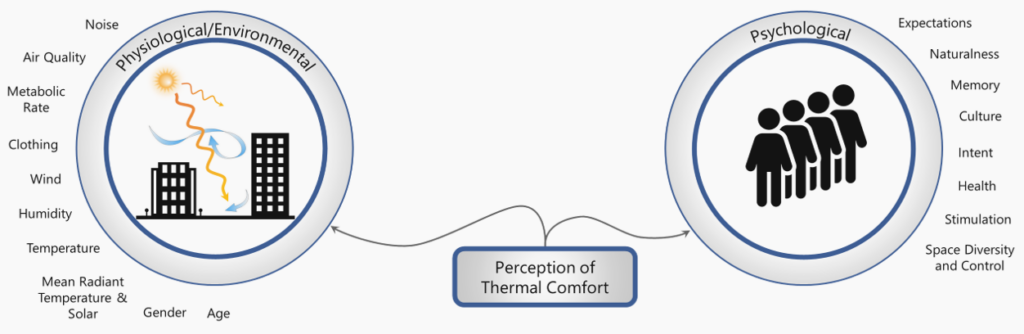
This is a complex concept, as it can assess not only an individuals’ perception of temperature which are reliant on both physiological/environmental causes, but also personal psychological factors.
What Metrics Do We Consider When Looking at Outdoor Thermal Comfort?
Outdoor thermal comfort metrics are nuanced and are typically presented at a higher level of granularity. They are used to convey varying levels of thermal discomfort but generally exclude safety concerns. A space might be deemed uncomfortable using a thermal comfort metric but not be flagged as a safety risk if a thermal risk metric is used. The metrics presented herein correlate comfort to six primary factors.
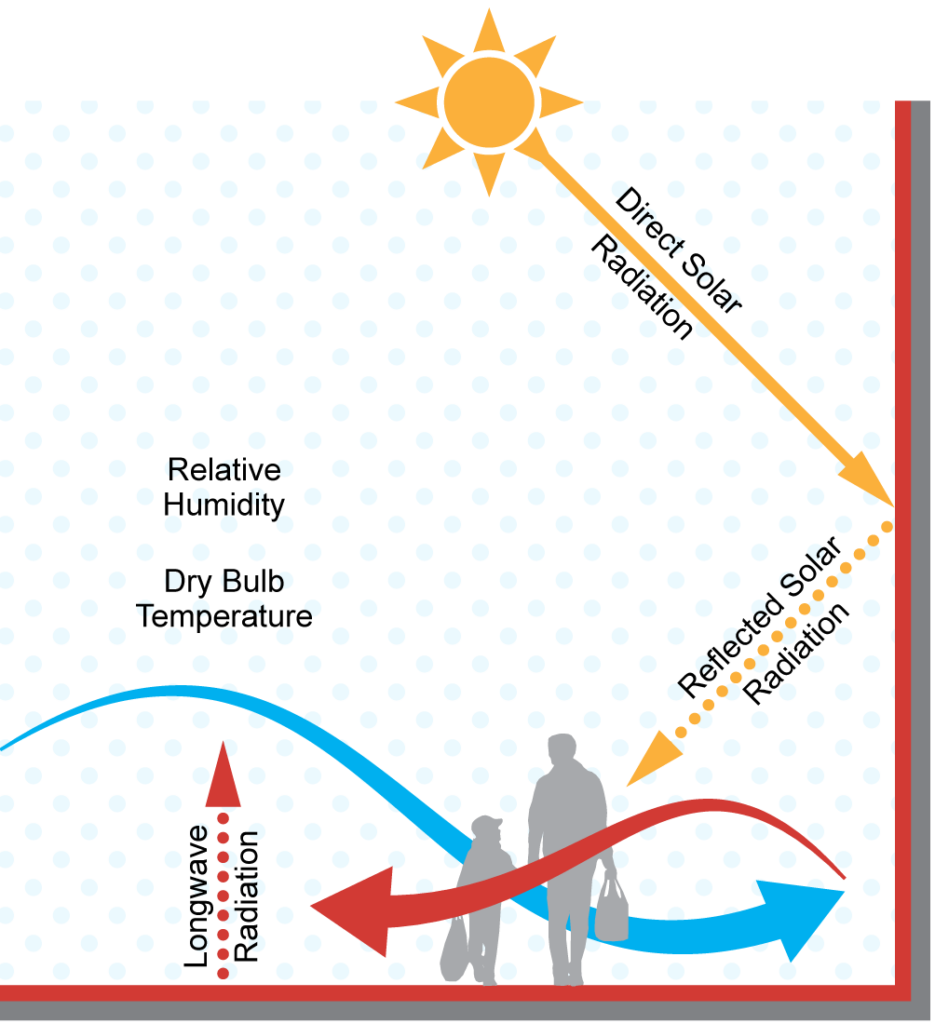
Four of the basic factors are related to the ambient environment when considering thermal comfort are:
- Dry bulb temperature
- Humidity
- Air speed
- Mean radiant temperature (temperatures of surfaces around the individual and solar radiation)
Another two additional metrics that can be considered are related to the individual. These personal or subjective factors are:
- Garment thermal resistance/insulation
- Metabolic rate (The heat generated by the human body resulting from physical activity)
It should be noted that there is a difference between thermal comfort and thermal risk. Thermal risk refers to issues of immediate life safety. Thermal stress metrics such as humidex, wind chill, and wet bulb globe temperature are used to convey extreme climate conditions that pose varying levels of health implications. For example, wind chill (which we will discuss in this blog post) is often used to predict the risk of frostbite or hypothermia.
Thermal comfort is a complex topic that combines an understanding of human behavior and physiological response to external environmental conditions. There is a myriad of thermal comfort metrics in existence. These range from simple objective metrics to complex metrics which combine thermal systems and survey results.
Different Approaches for Evaluating Thermal Comfort
Thermal comfort can be evaluated using a variety of different approaches from more simple metrics like Humidex and Windchill to much more nuanced methods. The following list includes and defines some common metrics and shows the factors that each consider when judging comfort.
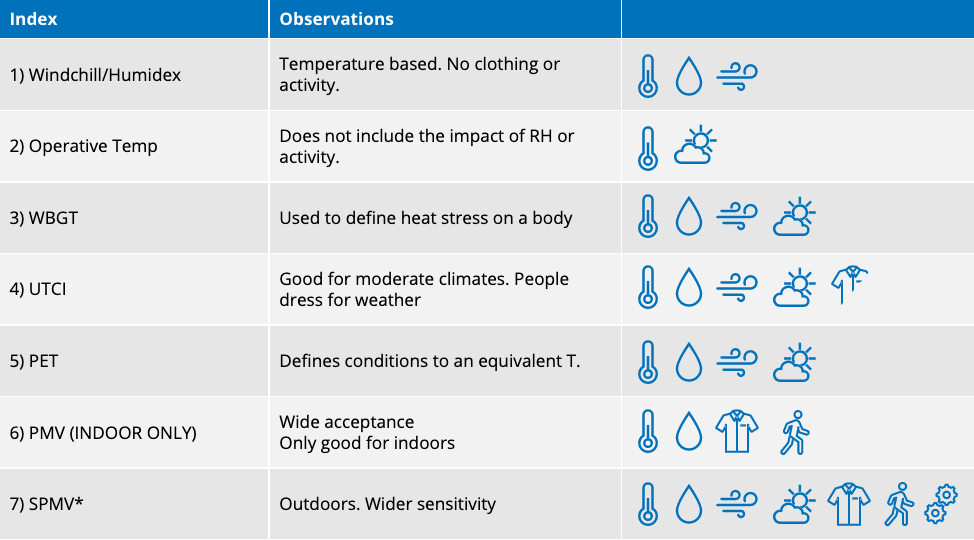
Let’s break down this chart a little bit and add some background into what each of these indexes mean. Here are some definitions:
Wind Chill
Wind Chill is a term used to describe what the air temperature feels like to the human skin due to the combination of cold temperatures and winds blowing on exposed skin. The colder the air temperature and higher the wind speeds, the colder it feels on your skin if you’re outside. So even if it remains the same temperature, but the wind speed increases it will feel colder to your skin.
Humidex or Heat Index
The heat index, or humidex, is what the temperature feels like to the human body when relative humidity is combined with the air temperature. This has important considerations for the human body’s comfort. Both scales use vapor pressure and dew point for the calculation, but the Canadians use a dew point base of 7°C for the humidex, whereas the United States of America uses 14°C. The Heat Index, however, incorporates variables other than the vapor pressure.
When the body gets too hot, it begins to perspire or sweat to cool itself off. If the perspiration is not able to evaporate, the body cannot regulate its temperature. Evaporation is a cooling process. When perspiration is evaporated off the body, it effectively reduces the body’s temperature. When the atmospheric moisture content (i.e. relative humidity) is high, the rate of evaporation from the body decreases. In other words, the human body feels warmer in humid conditions.
Operative temperature
Operative temperature (previously known as resultant temperature or dry resultant temperature but renamed to align with ASHRAE and ISO standards) is a simplified measure of human thermal comfort derived from air temperature, mean radiant temperature and air speed. It can be useful in assessing the likely thermal comfort of the occupants of a building.
WBGT – Wet Bulb Globe Temperature
Wet bulb globe temperature, or WBGT, is a perceived or apparent temperature. It is more a measure of how the weather feels than the exact weather itself. Specifically, WBGT is a measure of stress caused by the heat of direct sunlight.
To be accurate, one must take a variety of factors into account. Temperature, humidity, wind speed, sun angle, and cloud cover all affect sunlight, heat, and the stress perceived by the body while subject to the conditions in question.
PET – Physiological Equivalent Temperature
PET is defined as the air temperature at which, in a typical indoor setting (without wind and solar radiation), the heat budget of the human body is balanced with the same core and skin temperature as under the complex outdoor conditions to be assessed.
PMV – Predicted Mean Vote
PMV is an indoor-only index that is a function of six variables: physiological variables and the rest are environmental variables. The physiological or human personal variables are clothing insulation and activity level or metabolic rate. The environmental variables are air temperature, wind speed, relative humidity, and radiation temperature. Therefore, the thermal conditions felt by everyone in the same environment can have different sensations. PMV index values range from -3 to +3, which describes the feeling from cold to hot.
UTCI
The Universal Thermal Climate Index (UTCI) is a metric that attempts to quantify how people perceive given weather conditions by equating them to an equivalent temperature based on standard conditions. It calculates a comfort value for the actual conditions, and then determines an equivalent temperature that would create the same comfort value for that “standard” condition. The standard condition is a location at 50% relative humidity, low air speed, and mean radiant temperature equal to dry bulb.
UTCI is a straightforward metric that is easy to understand and easy to apply. It is widely used around the world to gauge thermal comfort, including in the City of London’s thermal comfort criteria.
SPMV
The “Standard Predicted Mean Vote Modified” (SPMV) metric is used as it can effectively account for the physics associated with elevated solar exposure and humidity ranges present outdoors. SPMV is a modified version of the ASHRAE PMV metric, originally developed by RWDI. It better accounts for the larger range of outdoor conditions and takes into consideration the type of clothing that the person is choosing to wear, along with the type of activity taking place in the specified location.
Another key thermal comfort concept is that of Urban Heat Islands, and it warrants a special place on this list:
Urban Heat Island
The urban heat island effect happens because the closely packed buildings and paved surfaces that make up our cities amplify and trap heat far more effectively than natural ecosystems and rural areas, which are often shaded by trees and vegetation and cooled by evaporating moisture. In addition, cities also generate their own heat, which is released from sources such as furnaces, air conditioners, and vehicles.
On a sunny day, paved surfaces can be a remarkable 27-50 °C hotter than the air. The difference is especially noticeable at night, when the heat captured by pavement and buildings during the day continues to warm the city after the sun goes down. Large cities can be as much as 12 °C warmer than their surrounding environments in the evening.
SPMV vs UTCI – What’s the Difference?
The two prominent indexes that are widely used in outdoor thermal comfort analysis for revolutionizing building design are UTCI and SPMV. While they both take several similar metrics into consideration, there are some key differences that can make each more applicable for specific projects, regions, and client preference. The key differences to understand in these indexes are:
Assumed Metabolic Rate and Activity
- UTCI uses a fixed metabolic rate or activity level (walking at 4.4 km/hr or 135 W/m2). This means that it assumes a standard level of activity for all individuals, which may not reflect actual conditions in different locations where people engage in either more or less active activities, such as sitting on a restaurant patio or briskly walking down a sidewalk.
- SPMV does not rely on a fixed metabolic rate but instead accounts for surveys and perceptions of individuals. It allows for variations in the activity level and metabolic rate based on the specific context, making it more adaptable to projects that have several outdoor spaces to take into consideration with varying levels of intended activity.
Clothing Worn
- UTCI automatically controls the clothing level in its calculations. This approach assumes that individuals adjust their clothing automatically for the given weather conditions, automatically removing layers of clothing as temperatures increase and adding layers as they decrease, which may not always reflect the reality that outdoor occupants face.
- SPMV does not control clothing level explicitly. Instead, it relies on the perceptions of individuals regarding their comfort level with their current clothing. While it may be more realistic that someone is not changing their clothing automatically as temperatures fluctuate, this too is not always the case 100% of the time.
Consideration of Cultural Factors
- UTCI may be challenging to apply in very warm climates or non-Western cultures due to its fixed assumptions about activity level and clothing. These assumptions may not align with the actual behaviors and preferences of individuals in different regions and cultures. For example, in many Middle Eastern cultures, clothing choices maybe selected based on religious or cultural factors. Because of this, there is no reasonable option for an outdoor occupant to remove several layers in a typically hot climate.
- SPMV is designed to be more tunable to different cultures and purposes of space. It is more suitable for assessing thermal comfort in various contexts and locations. It will consider, for example, a woman wearing an Abaya or Niqāb in scorching hot weather.
Perception vs. Quantitative Assessment
- UTCI aims to provide a quantitative assessment of thermal comfort by calculating equivalent temperature based on various factors like metabolic rate, clothing, and environmental conditions.
- SPMV is based on perceptions and surveys of individuals, where 80% of respondents agree on the condition they are feeling. It is not a definitive quantitative measure of thermal comfort but provides a guide to understanding comfort levels.
Acceptability of Discomfort
- UTCI, with its fixed parameters, may not adequately capture the range of acceptability for discomfort in different scenarios. For those who live in generally hotter climate conditions, it may be more acceptable to feel very warm or hot most of the time but could be almost unbearable to face cooler temperatures that people in more Northern climates may find comfortable.
- SPMV acknowledges that people may find a wider range of conditions acceptable outdoors and are willing to tolerate some measure of discomfort. It recognizes that thermal comfort is subjective and varies based on personal preferences and cultural norms.
Popularity and Familiarity
- UTCI is widely accepted as a global standard for thermal comfort analysis, making it a familiar metric in the field. This simplifies conversations with clients and stakeholders, as most people are generally aware of this index.
- SPMV is less known and may require more explanation and understanding when communicating with stakeholders.
Both UTCI and SPMV are valuable tools for outdoor thermal comfort analysis in building design, each offering unique advantages and considerations. Ultimately, the choice between UTCI and SPMV depends on the specific project context, region, and the level of cultural adaptability required to achieve optimal thermal comfort outcomes.
Next, we will look at how to interpret thermal comfort analysis results in a tool like Orbital Stack, which uses both the SPMV and UTCI index we have learned about above.
Interpreting Thermal Comfort Analysis Results
When preparing thermal comfort results in Orbital Stack, the analysis is performed on windows of time. This includes a season and a subset of the day (eg. summer mornings). The goal is to provide insights that do not span a set of wildly opposing conditions, but rather a relatively small and uniform period.
Even though that is the goal, results must still be taken in context. The raw metrics are based on the average condition during the analysis window. Comfort can still vary significantly across sample days and hours during that window. Because of the averaging, it has the potential to blur results by canceling warm samples against cold samples.
To alleviate this challenge, Orbital Stack also provides “Percent of Time In-bounds” plots. This evaluates each record within the analysis window against an upper or lower comfort bound (SPMV Comfortable or SPMV Acceptable) and measures the percentage of hours that are within the range. This has proven to be the most effective way to gauge the comfort of a particular location.
It is important to note that perceived comfort may also vary based on the local climate, and the expected and acceptable temperatures in that environment. Because of this, Orbital Stack uses two different color legends for both hot/tropical and temperate/cold climates, as shown below.
SPMV Color Legend for Hot and Tropical Climates
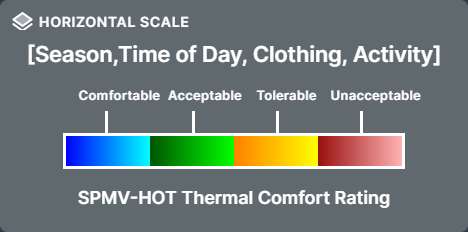
What does the scale mean?
This is a SPMV for hot and tropical climates. The color scale shows what the average thermal comfort conditions are at a location. The Season, Time of Day, Clothing Type and Activity Type is defined by the user (or predefined for them).
The color scale indicates four types of zones:
- Comfortable: this location is similar to indoors. No thermal stress.
- Acceptable: A person will generally accept this location as comfortable since they are outdoors. Some thermal stress.
- Tolerable: A person will stay at this location for some time but will seek better conditions.
- Unacceptable: Too hot. A person will seek cooler conditions.
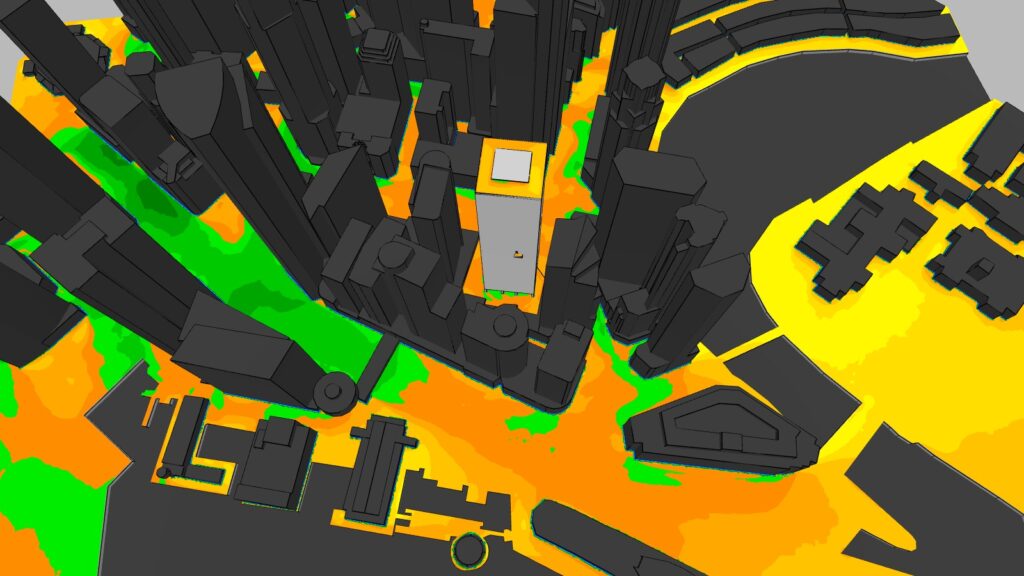
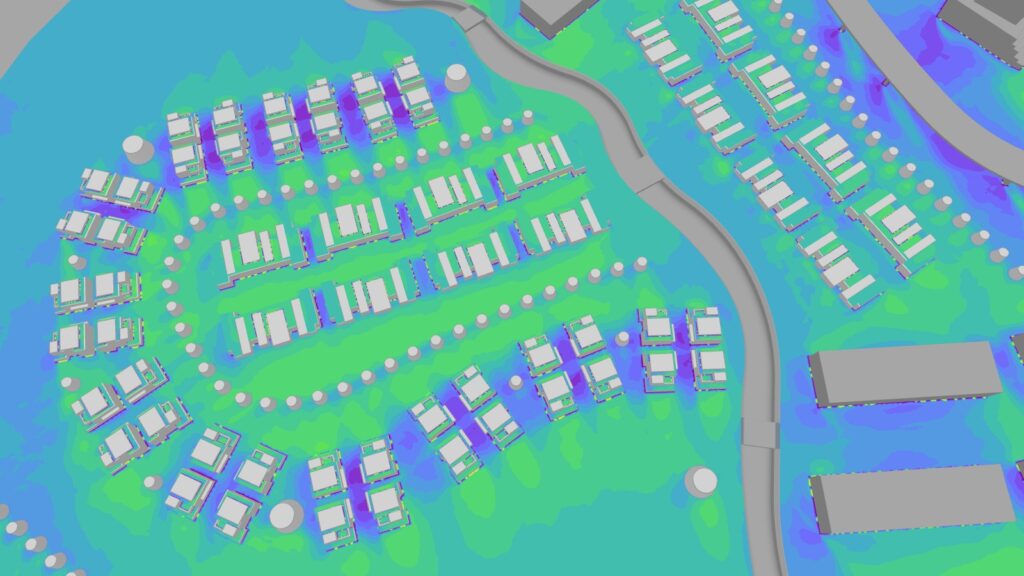
Project Example:
SPMV Color Legend for Temperate and Cold Climates
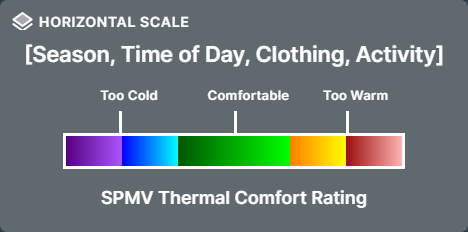
What does the scale mean?
This is a SPMV for temperate climates. The color scale shows what the average thermal comfort conditions are at a location. The Season, Time of Day, Clothing Type and Activity Type is defined by the user (or predefined for them).
The color scale indicates three types of zone:
- Comfortable – this location is similar to indoors. No thermal stress.
- Too Cold/Too Warm – a person will stay at this location for some time but will seek better conditions.
Project Example:

SPMV Color Legend for Percentage Inbounds
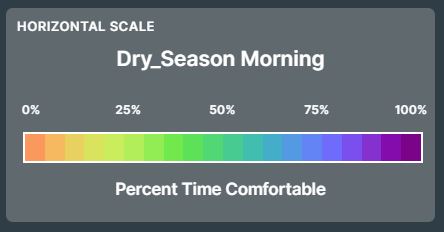
What does the scale mean?
The color scale indicates the percentage of hours within a specified time frame that are within the comfortable range. The Season, Time of Day, Clothing Type and Activity Type is defined by the user (or predefined for them). Example:
- 100% = All hours of the specified criteria (Season, Time of Day etc.) and are comfortable in the location colored dark green
Project Example:
Further Thoughts
When attempting to design comfortable outdoor environments, thermal comfort indexes play a vital role. We’ve explored various indexes used when considering outdoor thermal comfort, specifically looking at two prominent, wholistic indexes: UTCI (Universal Thermal Climate Index) and SPMV (Standardized Predicted Mean Vote). Each index comes with its own set of advantages and limitations, and the decision of which one to use ultimately depends on the specific context and the goals of project.
For those working in northern climates and Western cultures, UTCI could be the more straightforward choice. It is a standardized metric, widely accepted across the globe, and provides a quantitative assessment of thermal comfort. However, it’s essential to keep in mind that UTCI relies on fixed assumptions about activity levels and clothing, which may not accurately reflect real-world scenarios. People are guaranteed to engage in various activities and dress differently based on cultural norms.
On the other hand, if you find yourself in tropical climates, non-Western cultures, or if you seek a more nuanced understanding of different spaces’ thermal performance, SPMV emerges as a more flexible alternative. SPMV acknowledges the subjectivity of thermal comfort and caters to a broader range of acceptability for discomfort.